How do NCAA D1 football conferences compare when you actually analyze the season by numbers? All charts below are based on data from the end of regular season play.
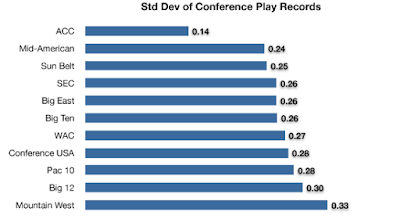
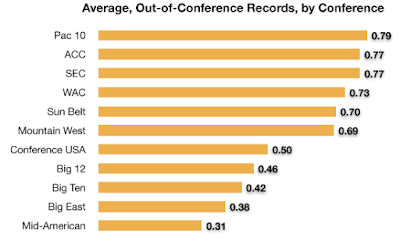
Watching ACC football this year was a bit sad, but there were so few ranked teams from the ACC in part because they kept beating each other. Here’s a comparison of in-conference play conference by conference, comparing the standard deviation of in-conference win percentages. Here’s how the conferences compare when they play each other. Here are the averages of out-of-conference win percentages by conference.
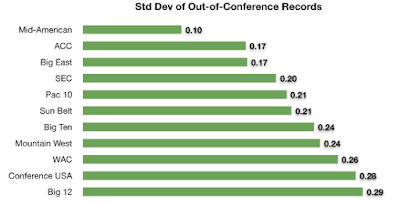
 Here’s how consistent the teams in each conference were in playing non-conference teams, by measure of the standard deviation of their out-of-conference win percentages.
 Keep in mind that none of these data account for which conferences played which. And the sample sets are pretty small. Some conferences are significantly bigger than others. It would be interesting to gauge how these data compare taking into consideration variables from off the playing field: athletic budgets, coaches salaries, average athlete SAT score, anthropology department budgets, etc.